Z spacing in case images?

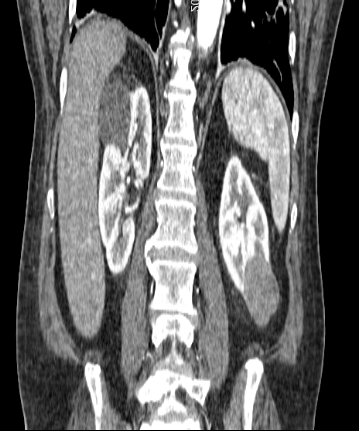
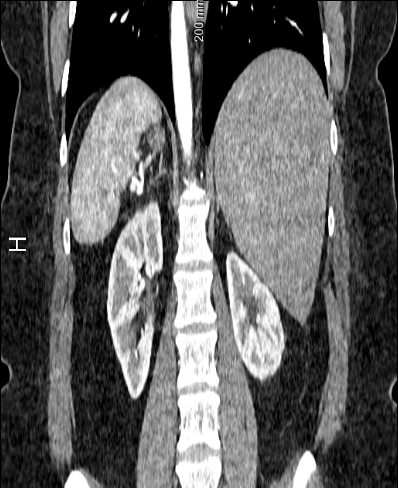
The default spacing values are 1, 0.92, 0.92 for z, x, y directions but the 3D volume looks stretched in the z direction (along Sagittal plane). Setting the z spacing (Sagittal plane) to be 0.5 makes 3D volumes look more real but what is the actual z spacing value?

Thanks,
Yanling

The Z-spacing varies from case to case. The values should appear in each respecive nifti1image.affine, as well as in kits.json. Which case are you referring to?

I found the same problem. There are some CT scans that look fine in 3D but others look stretched. I attached some figures below from case0002 and case0003. You can see this problem if you use slicer or Mevislab. Particularly, I am using SimpleITK to read the data directly from Python and it shows the same problem.

case0002

case0003

I’ve made an issue on GitHub for this here. I’m on travel through the rest of the week so I won’t be able to look in depth until next week, but I’ll be sure to get on it as soon as I can.

Thanks for helping with the quality assurance process!

Hi there, can you share how u use SimpleITK with Python, I seem to have an error with it.

I think you should resample to 1mm3 firstly.

What is the average of the slices (z)? It varies from how much to how much?

It varies from 1 to 5mm between slices. The average is a little over 3.4. Here’s a histogram:Screenshot%20from%202019-03-26%2016-02-40

you are using SimpleITK to display the dynamic images? or to save these static images in a folder?

I was using the official visualize.py to read the images, however, it show only one dimension(transverse plane).
could you please show me how you read the three dimensions?

I am not using visualize.py but I can image you can do it by modifying the lines 79-82. The following lines should show you the coronal view (I did not test it):

# Save individual images to disk
for i in range(viz_ims.shape[1]):
    fpath = out_path / ("{:05d}.png".format(i))
    scipy.misc.imsave(str(fpath), viz_ims[:, i, :])

Sorry for the late reply, you can do it by using:

import SimpleITK as sitk
import numpy as np

itkimage = sitk.ReadImage(filename)
numpyImage = sitk.GetArrayFromImage(itkimage)

now numpyImage is just a 3D array :slight_smile:

Thanks so much for your reply.I found I could make it by transpose the ‘‘vol’’ and ‘‘seg’’ matrix to achieve similar results . (All roads lead to Rome)

However, by this means, I could not find out the labels ("pre and post " or " lhb , lhe , rhb , and rhe for left hilum begin " referred in the data introduction) in my image. So here’re my two questions:
1.Can you find these labels in your image-display method?


2.Is the label information also restored in the viz_ims matrix? (shape of which is (107,521,521,3))

With regard to your first question, the pre, post, lhb, lhe, rhb, and rhe values do not explicitly appear in the imaging or ground truth segmentations. They were intermediate values recorded during the annotation process to aid in the creation of the final masks that were released.

A more detailed description of this process can be found in section 2.3 of the data descriptor preprint.

I am finding the images with very weak contrast, by the program of the Slicer gives to have a better visualization. Are there images where the contrast is better?

Could you give some examples of these cases? The images should all be in Hounsfield Units, and so contrast should only be an artifact of the software used to render them in pixel values.

how to show the three dimensions image? I use the visualize.py to read my images,but it just show one dimension–transerverse plane

itk-Snap is a nice tool for this. Otherwise you can view orthogonal planes with the visualize.py “plane” command line option. For instance:

$ python3 starter_code/visualize.py -c case_00123 -d ~/Desktop/test --plane coronal

Itk-Snap is an amazing tool.Thank you very much!